Russia's Economic
Challenges
Consider the general
dynamics/tasks involved
in transition to market economy
1) Legacies of communism
over-employment
poor work ethic
poor quality of
production
over-reliance on state subsidies
“cashless society”/barter
(in 1998 = 54% of
business
transactions)
2) “gray economy”
3) loss of market capture (SU and EE)
4)
“shock therapy” vs. gradualism
Russia didn’t do “shock
therapy” – gradualism is the problem
Russia's Economy
Comparable level of industrialization,
economic activity to Brazil
GDP plummeted 44 percent
1989-1998!
Unemployment
6.6% (2006)
Underemployment
Poverty
falling in recent years, but still about 18% (2004)
Life expectancy,
Rural decline,
out migration/in
migration
COUNTRY |
DEATHS PER 100,000 |
|---|---|
| (1) Russian Federation | 130.8 |
| (2) Hungary | 74.3 |
| (3) Romania | 61.8 |
| (4) Czech Republic | 56.7 |
| (5) Slovenia | 55.2 |
| (6) Cuba | 53.3 |
| (7) Poland | 51.9 |
| (8) Finland | 51.8 |
| (9) France | 51.4 |
| (10) Croatia | 47.0 |
Financial crisis of
1998; emergency aid from UN, World Bank, Japan
|
GDP
(purchasing power parity):
|
$1.723 trillion (2006 est.) |
|
GDP (official exchange rate):
|
$733 billion (2006 est.) |
|
GDP - real growth rate:
|
6.6% (2006 est.) |
|
GDP - per capita (PPP):
|
$12,100 (2006 est.) |
|
GDP - composition by sector:
|
agriculture:
5.3% industry: 36.6% services: 58.2% (2006 est.) |
|
Labor force:
|
73.88 million (2006 est.) |
|
Labor force - by occupation:
|
agriculture:
10.8% industry: 29.1% services: 60.1% (2005 est.) |
|
Unemployment rate:
|
6.6% plus considerable underemployment (2006 est.) |
|
Population below poverty line:
|
17.8% (2004 est.) |
|
Household income or consumption by
percentage share:
|
lowest
10%: 1.7% highest 10%: 38.7% (1998) |
|
Distribution of family income - Gini
index:
|
40.5
(2005) (US 45; UK 37; India 38; Mexico 53) |
|
Inflation rate (consumer prices):
|
9.8% (2006 est.) |
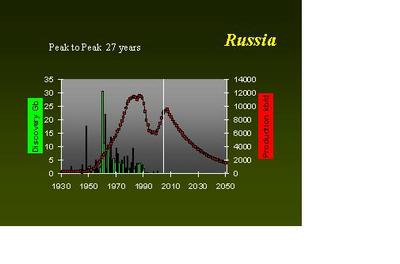
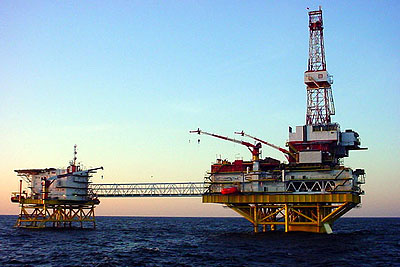
Key Sector of the Russian
economy:
Oil and Gas
Russia world’s second largest
oil producer
Russia's Oil Renaissance
Not an OPEC member
OPEC's fading
power
Russia defies
OPEC
Russian energy
giants
Energy exports account for
over 80% of Russian exports
World Bank estimates that oil and gas make up up to 25% of Russia's GDP
IMF estimates that
every $1 in yearly price for oil = .35 percent increase in GDP, or $1.8
bln (http://www.eia.doe.gov/emeu/cabs/Russia/Background.html)
Structure
of Russian Oil-Gas Industry
about 25% in state hands
Yukos seized; sold off to unknowns, Chinese
BP, Conoco-Phillips have
joint ventures
Russian exports to US
| Russian Net Imports of Petroleum into US (1995-2005) | ||
| Year | Crude ('000 bbl/d) |
Crude+Products ('000 bbl/d) |
| 1995 | 14 | 23 |
| 1996 | 18 | 19 |
| 1997 | 3 | 10 |
| 1998 | 9 | 22 |
| 1999 | 21 | 89 |
| 2000 | 7 | 72 |
| 2001 | 0 | 90 |
| 2002 | 85 | 209 |
| 2003 | 151 | 254 |
| 2004 | 150 | 280 |
| Jan-05 | 182 | 328 |
| Feb-05 | 269 | 428 |
| Mar-05 | 305 | 501 |
| Apr-05 | 464 | 645 |
| May-05 | 192 | 336 |
| Jun-05 | 116 | 350 |
| Jul-05 | 335 | 606 |
| Aug-05 | 56 | 237 |
| Sep-05 | 150 | 466 |
| Oct-05 | 180 | 450 |
| Nov-05 | 47 | 217 |
| Dec-05 | 52 | 284 |
| Jan-06 | 0 | 226 |
| Feb-06 | ||
| Ave. 1995-2003 | 34 | 88 |
| Ave. 1995-2004 | 46 | 107 |
| Ave 2005 | 196 | 404 |
| *Sources | ||
| 2005 - DOE/EIA Petroleum Supply Monthly, Table 52 | ||
| 2004 - DOE/EIA Petroleum Supply Monthly, Feb 2005 (YTD-Jan-Dec 2004). Table 50. | ||
| 1995-2003 DOE/EIA Petroleum Supply Annual, Table 29 | ||
| Contact: | ||
| Michael Cohen | ||
| michael.cohen@eia.doe.gov | ||
| (202) 586-7057 | ||