BIOCHEMISTRY TOPICS
Chemical kinetics: an introduction
Defining reaction rates. Rate law equations. Mechanisms and reaction coordinate diagrams.
clearly answer the question, "What is a reaction rate?" We will distinguish between average rates and instantaneous rates, and emphasize the idea that the rate we are usually most interested in is the initial rate, that is, the instantaneous rate at the very start of the reaction.
Reaction rates: Average and instantaneous
The rate or velocity of a chemical reaction is defined in terms of change in concentration of a reactant or product with time. Consider a simple chemical reaction with only one reactant that yields unspecified products:
A → products
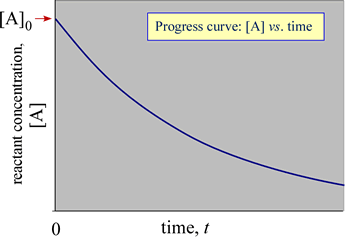
Let [A] be the concentration of this reactant, and consider how [A] changes with time t. If the initial conditions of this reaction are defined as [A] = [A]0 at t = 0, with no products present, a graph of [A] versus time would show [A] decreasing from its initial value with time as A is converted to products.

The graph of reactant or product concentration with time is called a progress curve for a reaction. Such a progress curve might look something like that shown at right. The analysis of the progress curve (or the underlying data) reveals the rate of the reaction and any dependence of the rate on the concentration of reactant(s).
The average rate over a time interval Δt is given by −Δ[A]/Δt. The minus sign is introduced to give the forward reaction velocity a positive sign. In making the time interval Δt very small, the average rate approaches the instantaneous rate at any time point within the interval. The instantaneous rate at any time t is the slope of the tangent to the curve at that value for t. The instantaneous rate when the reaction starts at time t = 0 is the slope of the tangent to the progress curve for t = 0 and is called the initial rate. The symbol V0 is used to designate the initial rate.
Rate laws and rate constants
When progress curves (plots of reactant or product concentration versus time) for a reaction are determined experimentally, they reveal patterns in the dependence of rate on concentration. Consider again the simple chemical reaction with only one reactant A. Letting [A] be the concentration of this reactant, and determining the initial rate of a reaction as initial concentration is varied, it is found that initial rates typically depend on starting concentrations as expressed by the equation
V0 = k[A]m
where V0 represents the initial rate, k is the rate constant, and m is some exponent that is a positive whole number. This equation is called the rate law. We call m the order of reaction, and most common are m = 1 and 2. If m = 1, the reaction is first-order in reactant A,and if m = 2, it is second-order in A. To accommodate additional reactants in more complex reactions, a distinction is made between individual order (order with respect to a given reactant) and overall order (the sum of the orders of all individual reactants). It is possible to observe zero-order reactions, in which initial rate is independent of concentration, as well as reactions with fractional order, such as 1/2 or 3/2.
The half-life (t1/2) of a reaction is the time required for one-half of the an initial amount of reactant to be consumed. Expressions can be derived for the half-life of reactions according to their orders.
Reaction mechanisms
The rate law can be explained, or predicted, by a reaction mechanism which is a series of one or more elementary steps in which reactants or reaction intermediates physically encounter one another and lead to other reaction intermediates or products.
Reaction coordinate diagrams
To help us understand the reason why an energetically favorable reaction (i.e. products are favored, and Keq large) may nonetheless take place at only a very slow rate, we introduce a representation of a reaction called a reaction coordinate diagram. Such diagrams are used frequently in chemistry, being useful in illustrating many features of chemical reactions, such as the activation energy of a reaction, and helps illuminate the relationship between chemical kinetics and chemical equilibrium.
Related topics pages:
- enzyme kinetics
- Michaelis-Menten equation (enzyme kinetics)