BIOCHEMISTRY TOPICS
Dihedral (or torsion) angles
Definitions of bond angle and dihdral (torsion) angle. Polypeptide main chain dihedral angles, φ, ψ, and ω. Ramachandran plots.
The conformations that biological molecules adopt determine the physical and chemical properties they exhibit in biological systems. Therefore, we need a way to describe the conformations observed for the types of molecules studied in biochemistry. The principal focus in this section will be on polypeptide conformations, as a preparation for understanding structure-function relationships in proteins
A dihedral angle - also called torsion angle - is defined by four sequentially bonded atoms. This is represented in the figure below by the structure A-B-C-D (second panel; note the distinction between bond angle and torsion angle). Imagine looking along the bond between atoms B and C (as indicated by the arrow). This is the central bond of the three bonds defined. At first, we see the B-C bond in the plane of the figure, with the B-A bond pointing to the left and up out of the plane, and the C-D bond pointing down and to the right. Then we pick up this structure, and begin to turn it so that we can look straight down the B-C bond (third panel). Eventually, our view is equivalent to the Newman projection in the last panel. From this view, the dihedral angle τ is the apparent angle subtended by D relative to A, as shown. We define the range of values of dihedral angles to be [−180°, +180°], and the value of τ is about -150° (The negative part of the range corresponds to when D is counterclockwise relative to A.)
Of course, other atoms may be attached to B and C - and usually are. We would have to specify which atoms correspond to A, B, C, and D to unambiguously define dihedral angle. For long unbranched polymers, like proteins, it makes sense to require that A through D are all main chain atoms. Below is a molecular graphics image that corresponds to the above sketch and illustrates the definition of the polypeptide main chain dihedral angle Phi (φ).
Polypeptide main chain dihedral angles: Phi (φ), Psi (ψ), and Omega (ω)
A dihedral angle is defined by four atoms. It can be visualized by looking down the central bond (i.e. the bond from atom 2 to atom 3). The dihedral angles along a polypeptide chain are of three types:
Phi (φ) - central bond between N(i) [the amide nitrogen of residue i] and C(alpha, i) [the alpha carbon of residue i]. Look down the N(i)-Cα(i) bond, note the angle subtended by acyl carbon C(i) relative to C(i-1) - the acyl carbon from the previous residue.
Psi (ψ) - central bond between C(alpha, i) and C(i) [the acyl carbon of residue i]. Look down the Cα(i)-C(i) bond, note the angle subtended by N(i + 1) relative to N(i).
Omega (ω) - the peptide bond between the acyl carbon C(i) and N(i+1) is the central bond.
Phi (φ) and psi (ψ) are sometimes referred to as Ramachandran angles, since they are used in a two-dimensional plot of main-chain dihedral angles called a Ramachandran plot (see below).
Ramachandran plot
The Ramachandran plot is a graph of the main chain dihedral angles phi (φ) and psi (ψ) for a polypeptide chain, with phi (φ) values along the x-axis and psi (ψ) values along the y-axis.
The layout of a Ramachandran plot as typically presented in textbooks is shown at left (click on figure to display a larger version). The contours indicate the extent of allowed (light green) and most favored (dark green) combinations of (φ, ψ). The orange circles show the locations of the ideal phi, psi values for the most common regular secondary structural features, beta strands (in antiparallel and parallel sheets) and alpha helices. Outside the countours, the corresponding conformations are disfavored or disallowed. The exact locations of the countours should not be taken too literally, as the favorable and allowed regions depend on residue identity. Glycine, in particular, has much greater allowed regions than shown here. This is discussed further below.
A "real" Ramachandran plot
In the "end-game" of protein structure determination, the experimentally-determined model must be analyzed for its stereochemical quality. Serious problems with the model may be indicated if there are instances of non-Gly residues whose main-chain dihedral angles lie outside of the allowed regions, or if too high a proportion of the residues are outside of the most-favored region. An example of a Ramachandran plot for a protein of 190 residues is shown in the accompanying figure.
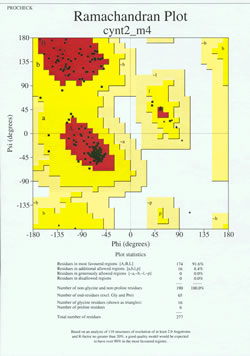
The figure shows a Ramachandran plot for a protein structure determined by X-ray crystallography. (Click on it to view a larger version of it in a new window.) Each black square represents the conformation of the main chain at one residue of the protein. Note how the phi, psi values for the residues cluster in the red "most favoured" regions. The red region at upper left (labeled "B" in the figure) corresponds to residues in a beta strand conformation of the main chain, while the large area near the middle (labeled "A") corresponds to alpha helix. The third, small red area of the plot is where residues that adopt a left-handed ("L") alpha helix are located. Some of the residues lie in "additional allowed regions" (bright yellow) that border the most favored regions. Note how the glycine residues (indicated as triangles) lie in some cases in "disallowed regions". This is because Gly, with only the small hydrogen atom as its "side chain", is much less sterically encumbered than other amino acids. Gly is able to adopt pairs of phi, psi angles that are not allowed for any other residue.